

Learning how to use Microsoft Excel can change the way you work, study, or manage your daily tasks. Excel is more than just a grid of rows and columns—it’s a powerful tool for organizing information, solving problems, and making decisions.
Whether you’re a beginner or someone who wants to improve your skills, understanding Excel’s basics and advanced features opens up new possibilities. From simple calculations to creating charts and analyzing data, Excel helps you work faster and smarter. This guide will show you, step by step, how to use Microsoft Excel efficiently, with practical examples and tips that many new users overlook.

36% off Today’s Exclusive Deals
Limited-time Exclusive Deals. Check current discount on Amazon.
Check Price on Amazon As an Amazon Associate I earn from qualifying purchases.Getting Started With Microsoft Excel
Opening Microsoft Excel for the first time can feel intimidating. But once you learn a few key concepts, the interface becomes much easier to understand.
Understanding The Excel Interface
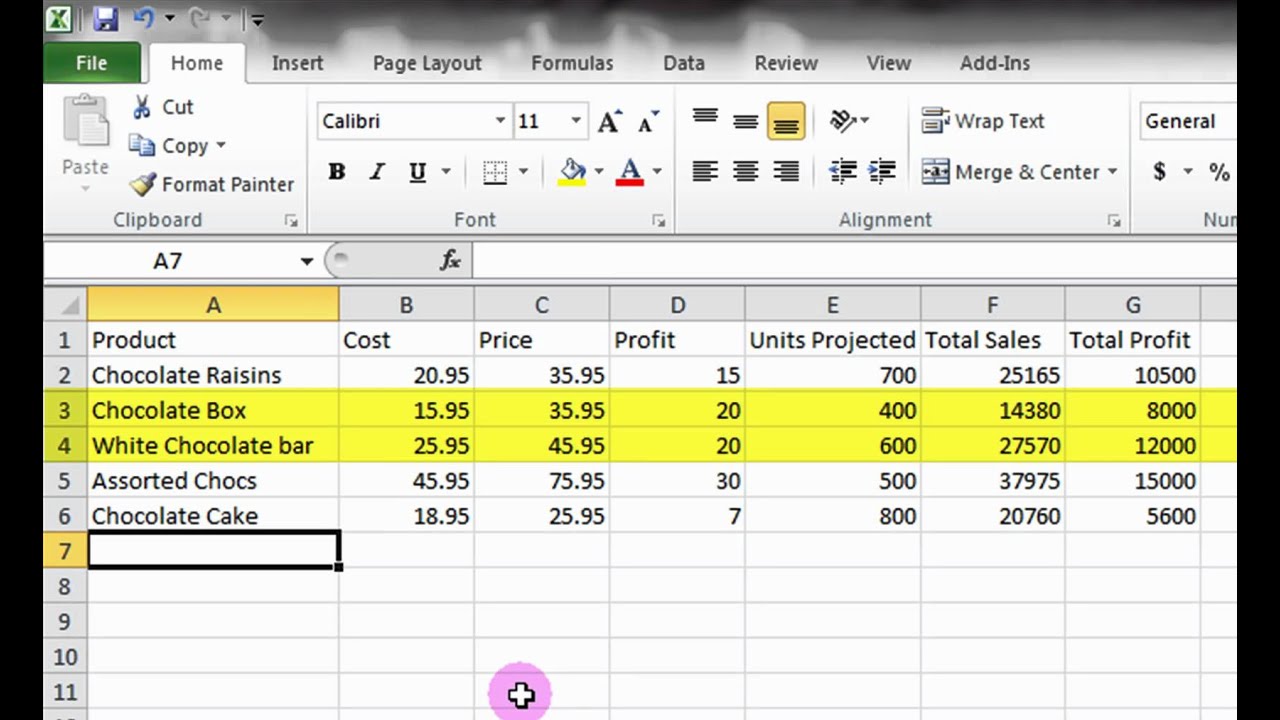
When you start Excel, you see a worksheet. It looks like a grid made of rows (numbered 1, 2, 3…) and columns (labeled A, B, C…). Each small box is called a cell. You can enter numbers, text, or formulas into any cell.
At the top, you’ll find the Ribbon. This is a menu with tabs like Home, Insert, and Data. The Ribbon gives you access to Excel’s main tools.
- Quick Access Toolbar: Lets you save, undo, and redo actions quickly.
- Formula Bar: Shows what’s inside the selected cell.
- Status Bar: At the bottom, displays useful info like sum or average if you select several cells.
Creating A New Workbook
A workbook is an Excel file. Each workbook can have multiple worksheets (tabs at the bottom named Sheet1, Sheet2, etc.).
To create a new workbook:
- Open Excel.
- Click “Blank Workbook.”
- Save your file by clicking “File” > “Save As.” Choose a name and location.
Basic Navigation
- Click a cell to select it.
- Move around using arrow keys or your mouse.
- To select a group of cells, click and drag, or hold Shift and use arrow keys.
Non-obvious insight: You can use Ctrl+Arrow Key to jump to the end of a row or column, which saves time when working with large data sets.
Entering And Formatting Data
Once you know how to move around, the next step is to enter and format data so it’s easy to read and understand.
Typing Data Into Cells
Click any cell and start typing. Press Enter to move down, or Tab to move right.
- Numbers: Type directly (e.g., 25).
- Text: Type words or sentences.
- Dates: Type in common formats (e.g., 4/15/2024 or April 15, 2024).
Formatting Cells
Formatting makes your data look better and easier to read. You can change the appearance of cells in many ways.
- Font size, color, and style: Select cells, then choose options on the Home tab.
- Number format: Change how numbers appear (currency, percentage, decimal).
- Alignment: Center, left, or right alignment.
Practical Example
Imagine you’re making a budget:
| Item | Cost ($) |
|---|---|
| Rent | 1200 |
| Food | 300 |
| Utilities | 150 |
| Internet | 50 |
To make this table:
- Enter the items in column A.
- Enter the costs in column B.
- Select both columns and use “Bold” for headers.
Non-obvious insight: Use Format Painter to quickly copy formatting from one cell to others. Click the cell you like, click the Format Painter button, then click other cells.

Using Formulas And Functions
Excel’s real power comes from its ability to calculate and process data. Formulas and functions let you do math, analyze data, and automate tasks.
Writing Basic Formulas
Every formula starts with an equals sign (=). For example:
- `=A2+B2` adds the values in cells A2 and B2.
- `=A2B2` multiplies them.
You can use parentheses for complex calculations:
- `=(A2+B2)C2`
Common Functions
Functions are built-in formulas that save time. Some popular ones:
- SUM: Adds numbers. `=SUM(B2:B5)`
- AVERAGE: Finds the mean. `=AVERAGE(B2:B5)`
- MIN/MAX: Finds smallest/largest. `=MIN(B2:B5)`, `=MAX(B2:B5)`
Example Of Function Use
Suppose you have sales numbers:
| Month | Sales ($) |
|---|---|
| Jan | 500 |
| Feb | 650 |
| Mar | 700 |
To find the total sales:
- Select the cell below the sales numbers.
- Type `=SUM(B2: B4)` and press Enter.
Formula Errors
Common mistakes:
- Forgetting the equals sign.
- Using the wrong cell reference.
- Typing numbers instead of using cell references (hard to update later).
Non-obvious insight: Double-click the lower-right corner of a cell with a formula to auto-fill the formula down a column.
Sorting And Filtering Data
When you have a lot of information, sorting and filtering help you find what you need quickly.
Sorting Data
To sort a list:
- Select the range you want to sort.
- Click the “Sort & Filter” button on the Home tab.
- Choose to sort ascending (A-Z, smallest to largest) or descending (Z-A, largest to smallest).
Filtering Data
Filters let you show only the rows that meet certain conditions.
- Select your table.
- Click “Filter” in the Home or Data tab.
- Small arrows appear in the header cells. Click an arrow to choose which values to show.
For example, filter your budget table to show only items costing more than $100.
Comparison Table: Sorting Vs Filtering
| Feature | Sorting | Filtering |
|---|---|---|
| Purpose | Arrange data in order | Show only certain rows |
| Data Visibility | All data visible | Some data hidden |
| Examples | Sort by price, name | Show only items above $100 |
Practical tip: Always check that your entire table is selected before sorting, or you might mix up your data.
Creating Charts And Visuals
Charts help you see trends and patterns in your data. Excel makes it easy to turn numbers into visuals.
Types Of Charts
- Column Chart: Compares values across categories.
- Line Chart: Shows changes over time.
- Pie Chart: Shows parts of a whole.
- Bar Chart: Similar to column, but horizontal.
Making A Chart
- Select your data, including headers.
- Click “Insert” > “Charts.”
- Choose the type of chart you want.
- Excel creates the chart automatically. You can move it, resize it, and change the style.
Example: Sales By Month
| Month | Sales ($) |
|---|---|
| Jan | 500 |
| Feb | 650 |
| Mar | 700 |
Select this data and insert a column chart. You’ll see sales for each month side by side.
Customizing Charts
- Change colors and styles with Chart Tools.
- Add titles and labels to explain your chart.
- Right-click any part of the chart to adjust details.
Non-obvious insight: Double-click any part of a chart to open advanced formatting options. This lets you customize almost every detail.
Working With Multiple Worksheets
A single Excel file can have many sheets, which helps organize different types of information.
Adding And Renaming Worksheets
- Click the plus (+) button at the bottom to add a new sheet.
- Double-click a sheet tab to rename it.
For example, you might have one sheet for your budget, another for your shopping list.
Linking Data Between Sheets
You can use formulas to pull data from one sheet to another.
- If Sheet1 has a value in cell A1, on Sheet2 you can type `=Sheet1!A1` to show that value.
This helps keep your data connected and updated.
Practical Example
Suppose you have a summary sheet and a detailed expenses sheet. Link total expenses from the detail sheet to the summary sheet using a formula.
Tip: Color-code your sheet tabs to quickly identify different types of data.
Data Validation And Protecting Your Data
As your data grows, mistakes can happen. Excel has tools to prevent errors and protect important information.
Data Validation
Data validation makes sure only correct values are entered.
- Select the cells you want to control.
- Click “Data” > “Data Validation.”
- Set rules (e.g., only allow numbers between 1 and 100).
If someone tries to enter the wrong value, Excel shows a warning.
Protecting Worksheets
To prevent accidental changes:
- Click “Review” > “Protect Sheet.”
- Set a password and choose which actions are allowed.
This is useful when sharing files with others.
Comparison Table: Data Validation Vs Protecting Worksheets
| Feature | Data Validation | Protecting Worksheets |
|---|---|---|
| Purpose | Control data entry | Prevent unwanted changes |
| How it works | Sets rules for input | Requires password for edits |
| Common uses | Limit input to numbers | Lock formulas or cells |
Non-obvious insight: You can use custom formulas in data validation, such as only allowing dates in a certain range.
Importing And Exporting Data
Excel can work with data from other sources or share your data with other programs.
Importing Data
You can bring in data from:
- CSV files: Simple text files with commas separating values.
- Text files: Data separated by tabs or spaces.
- Online sources: Like databases or websites.
To import:
- Click “Data” > “Get Data.”
- Choose your source.
- Follow the steps to load data into Excel.
Exporting Data
To share your Excel data:
- Save as CSV if you want a simple file.
- Save as PDF for easy sharing.
- Use “File” > “Save As” and choose the format.
Practical Example
Export your monthly sales table as a CSV file to upload to a website or another program.
Tip: When importing data, always check for formatting issues like extra spaces or wrong column names.
Using Advanced Tools: Pivottables And Conditional Formatting
For deeper analysis, Excel offers PivotTables and Conditional Formatting.
Pivottables
PivotTables let you summarize large amounts of data quickly.
- Select your data.
- Click “Insert” > “PivotTable.”
- Choose where to place the PivotTable.
- Drag fields to rows, columns, and values.
Example: Summarize sales by product and month.
Conditional Formatting
Conditional Formatting changes cell appearance based on values.
- Select cells.
- Click “Home” > “Conditional Formatting.”
- Set rules (e.g., highlight cells above $500).
This makes important data stand out.
Comparison Table: Pivottables Vs Conditional Formatting
| Feature | PivotTables | Conditional Formatting |
|---|---|---|
| Purpose | Summarize data | Highlight data visually |
| Usage | Drag-and-drop fields | Set color rules |
| Examples | Sales by region | Highlight top performers |
Tip: Use PivotTables to spot trends or patterns in large lists, like sales reports or survey results.
Automating Tasks With Macros
If you do the same steps again and again, macros can help. Macros record your actions and let you play them back with one click.
Recording A Macro
- Click “View” > “Macros” > “Record Macro.”
- Give your macro a name.
- Do the steps you want automated.
- Click “Stop Recording.”
Now, you can run the macro anytime.
Using Macros Safely
Macros can be powerful, but be careful when running macros from others. They can change or delete data.
Tip: Always check macro settings in the Trust Center for security.
Collaborating And Sharing In Excel
Excel is not just for solo work. You can collaborate with others and share your files.
Sharing Workbooks
- Use “File” > “Share” to send via email or cloud (like OneDrive).
- You can let others view or edit your file.
Co-authoring
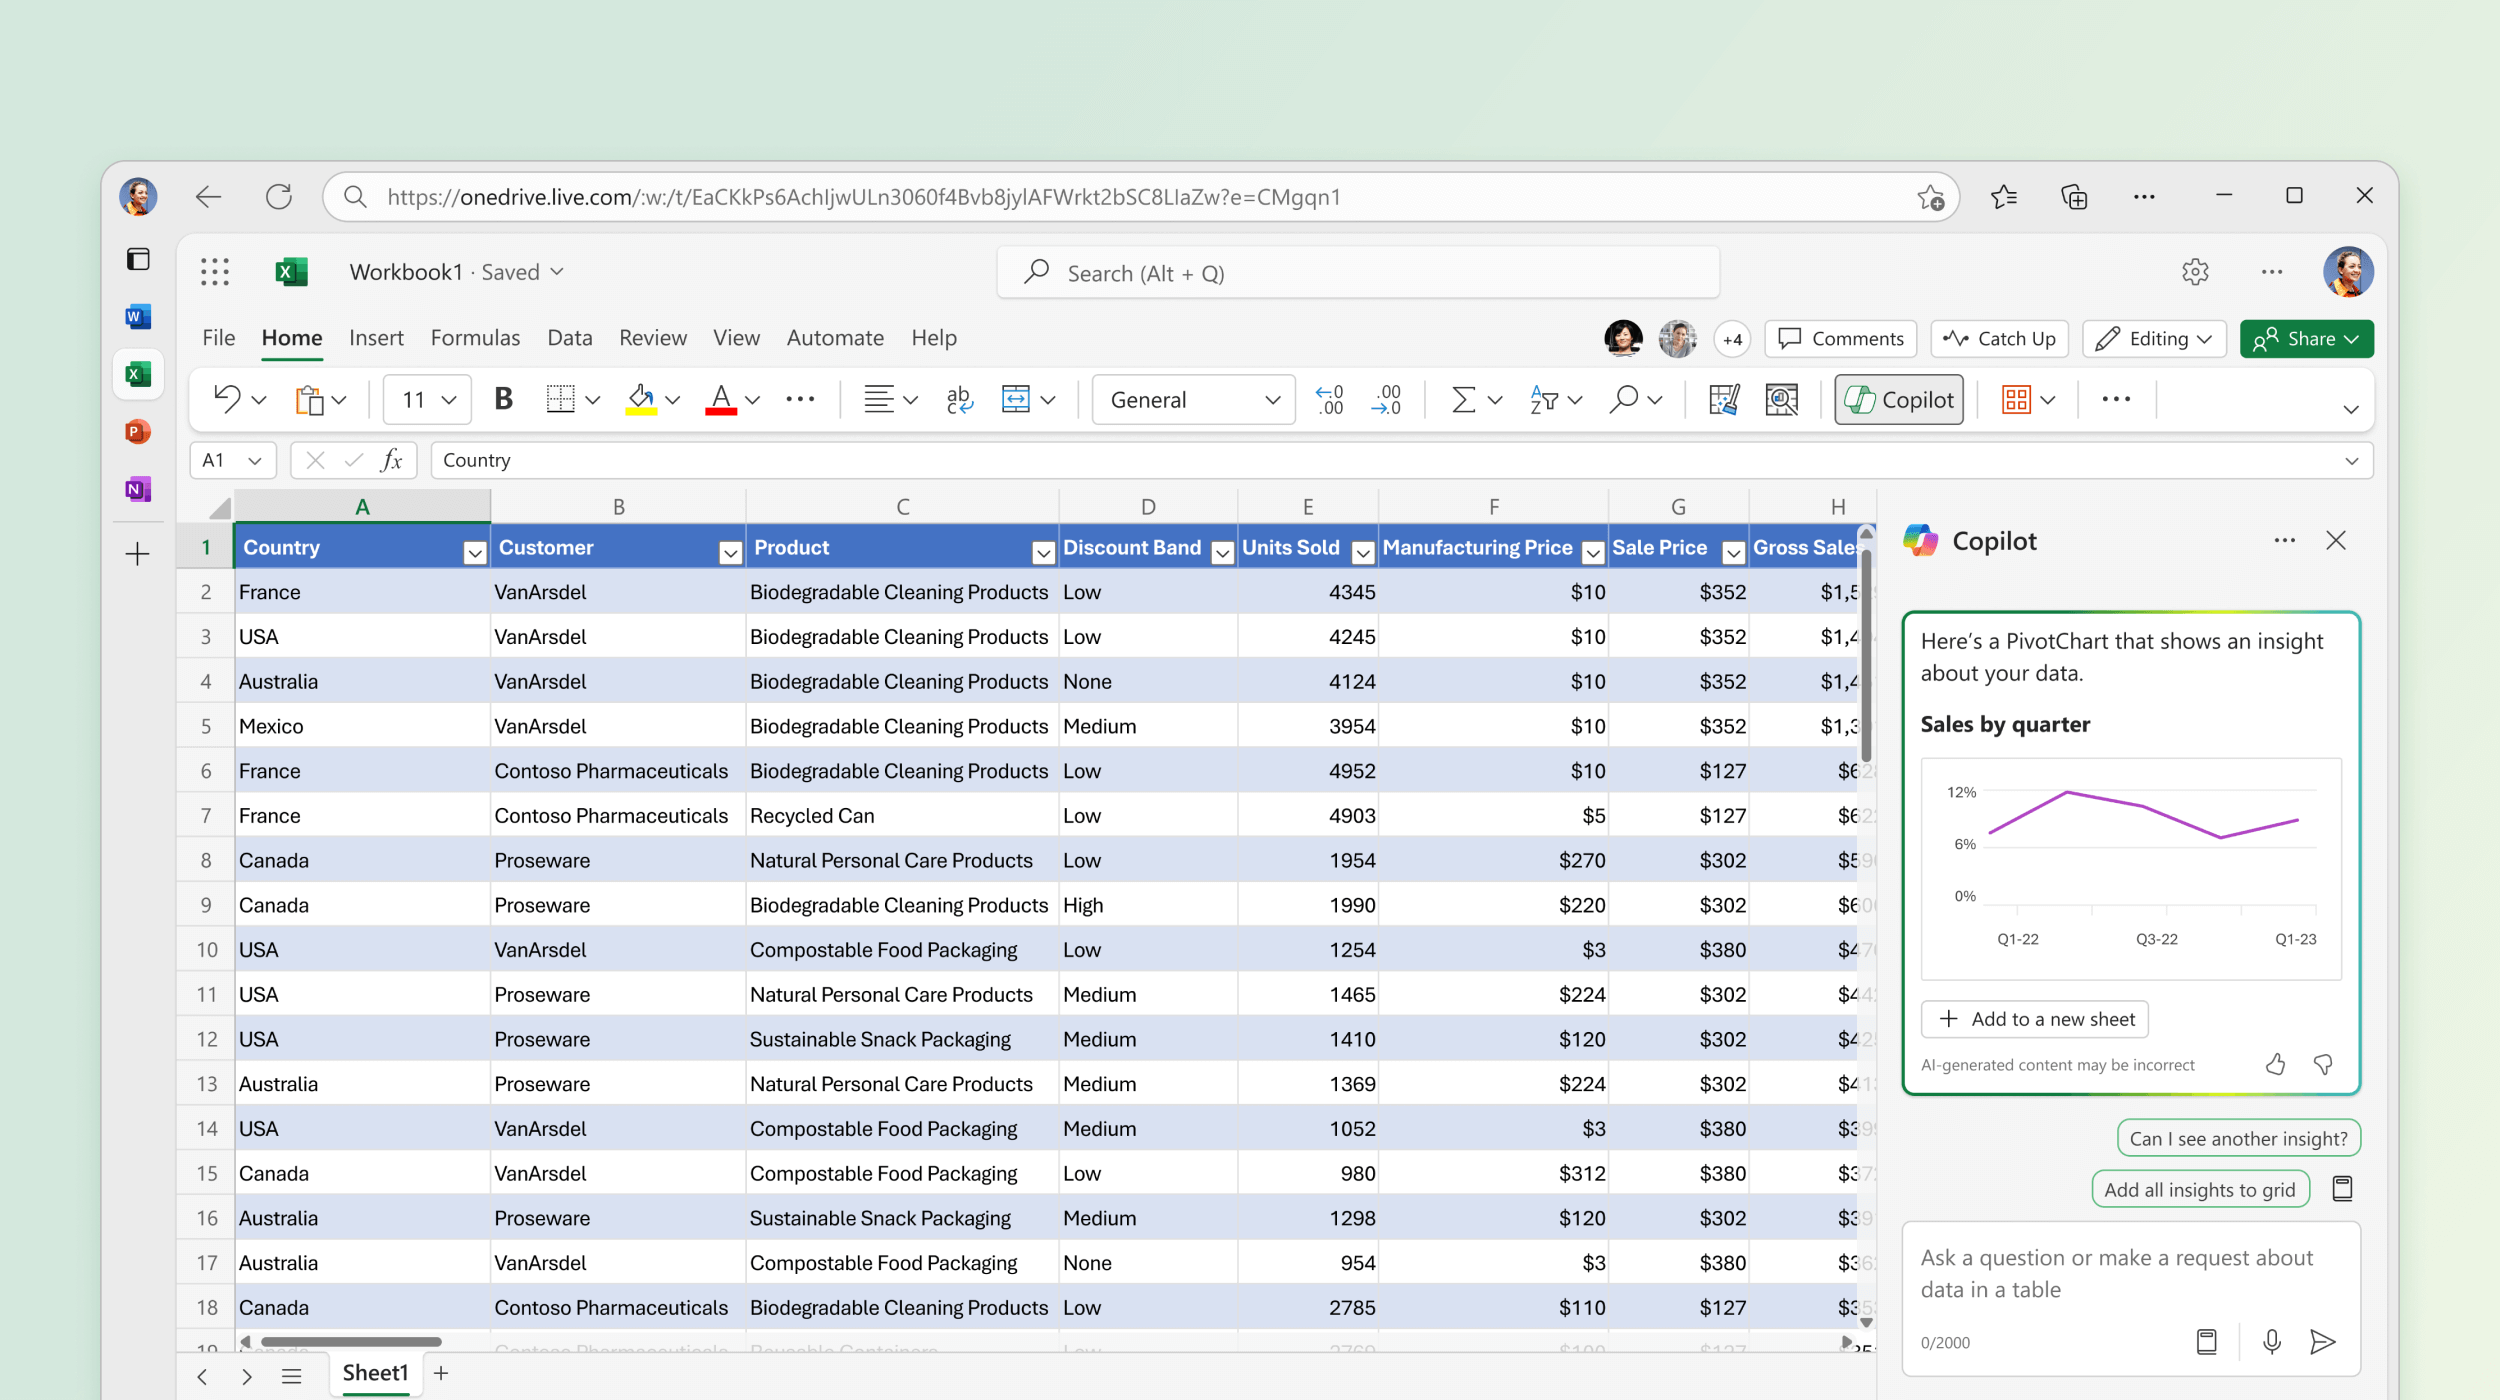
With Excel Online, multiple people can work on the same file at once.
- Changes update in real time.
- You can see who else is editing.
Commenting And Notes
Add comments to cells for feedback or questions.
- Right-click a cell, choose “Insert Comment.”
Non-obvious insight: Use Threaded Comments in Excel Online for conversations inside your file.
Real-life Examples Of Excel Use
Excel is used everywhere—from business to school, from home budgets to scientific research. Here are a few real-life scenarios:
- Small Business Inventory: Track products, prices, and stock levels.
- Personal Finance: Manage budgets, expenses, and savings.
- School Grading: Calculate averages and grades for students.
- Project Planning: List tasks, deadlines, and resources.
Data from Wikipedia shows Excel is the most widely used spreadsheet tool, with over a billion users worldwide.
Frequently Asked Questions
What Is Microsoft Excel Used For?
Microsoft Excel is used for organizing, analyzing, and visualizing data. You can make budgets, track sales, calculate grades, plan projects, and more. It’s useful for both simple tasks and complex calculations.
How Do I Create A Formula In Excel?
To create a formula, click a cell, type an equals sign (=), then enter your calculation. For example, `=A1+B1` adds the values in cells A1 and B1. Press Enter to see the result.
Can I Use Excel On My Phone?
Yes, Microsoft Excel is available as a mobile app for iOS and Android. You can view, edit, and share files on your phone or tablet. Some advanced features may not be available on mobile.
How Do I Protect My Excel File From Changes?
You can protect your file by clicking “Review” > “Protect Sheet” or “Protect Workbook. ” You can set passwords and choose which actions are allowed, like editing cells or formatting.
What Is A Pivottable And Why Should I Use It?
A PivotTable is a tool in Excel that summarizes large amounts of data. You can quickly see totals, averages, and trends by dragging fields into rows, columns, and values. It’s useful for analyzing business data, survey results, and more.
Mastering Microsoft Excel takes practice, but the rewards are great. Start with the basics, explore more features, and you’ll find yourself solving problems faster, making better decisions, and saving time every day.